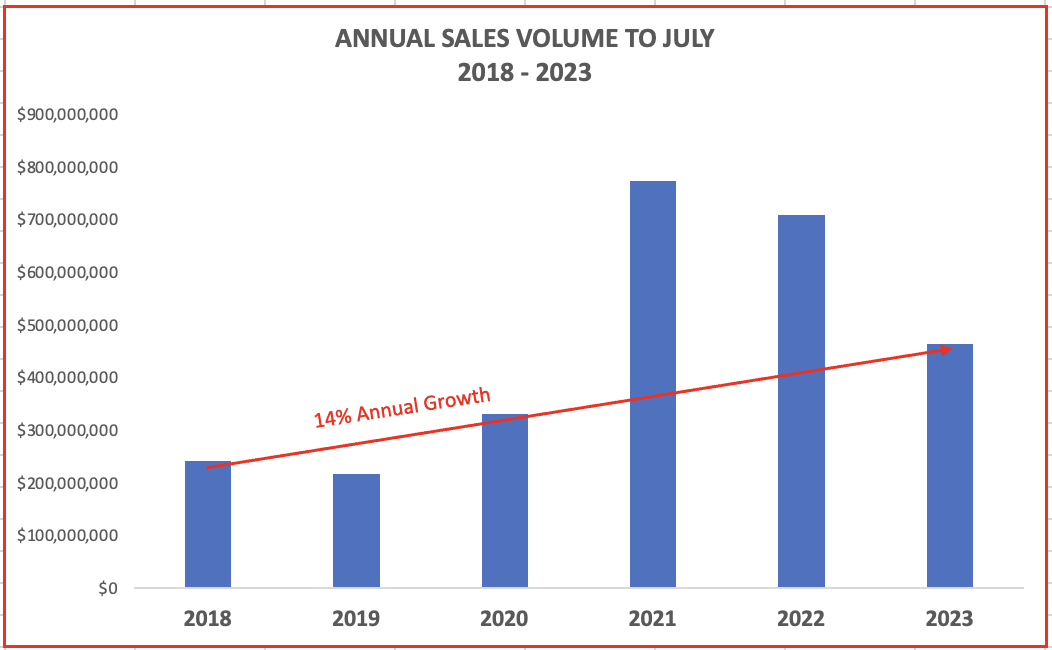
We have just reviewed the July sales data for the Telluride market area.
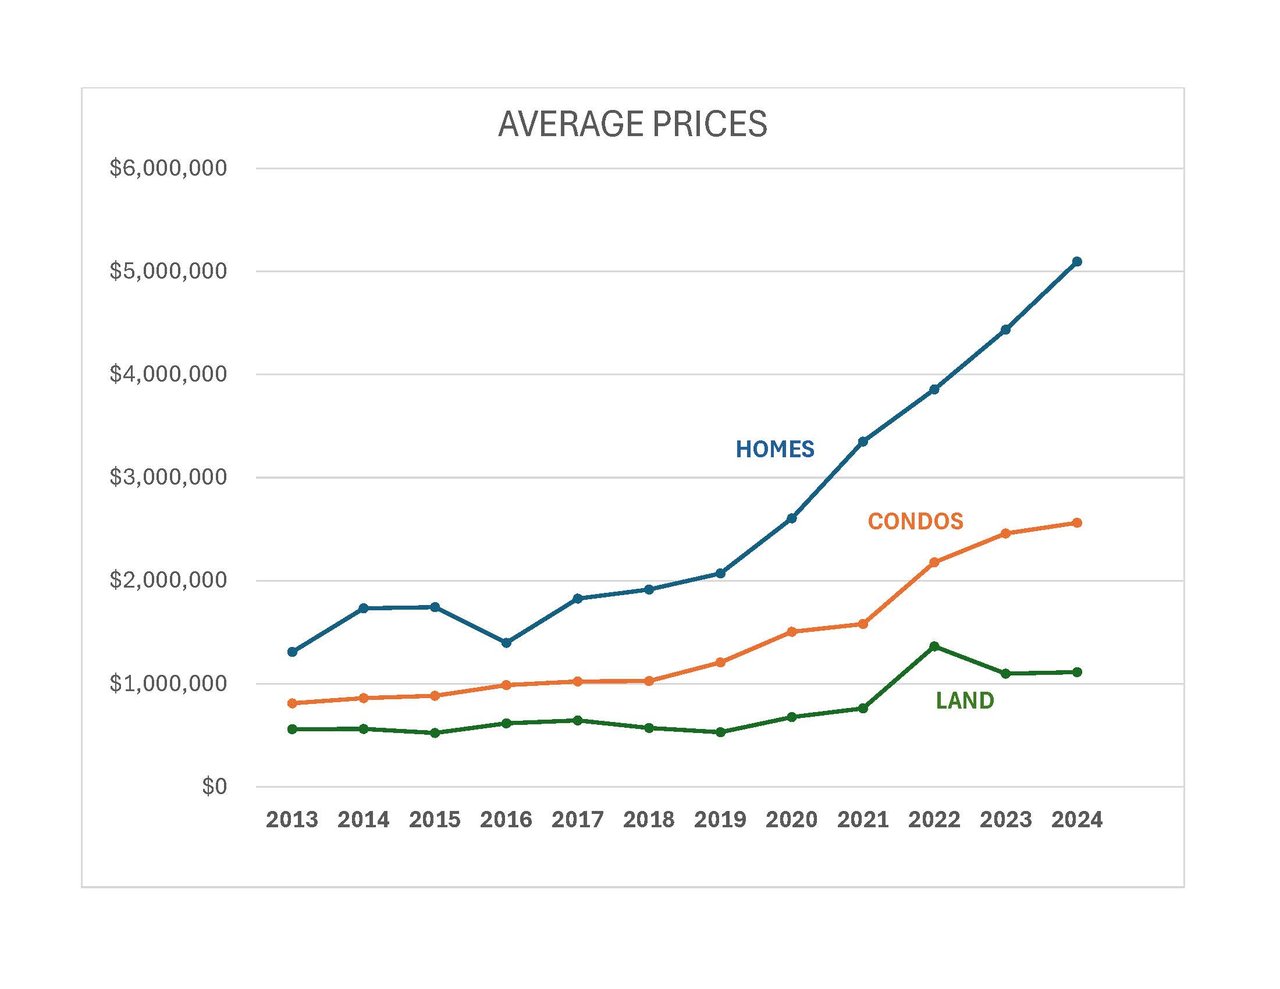
It says some interesting things. Our market sale volume has returned to the trend line that was building from 2018 to 2020. The wonderful covid years (I really said that?) were an aberration. The Covid scramble for escape in 2021 and 2022 resulted in a huge real estate sales spike. Comparing the 2023 data to 2022 data makes it look like we fell off a cliff in 2023.
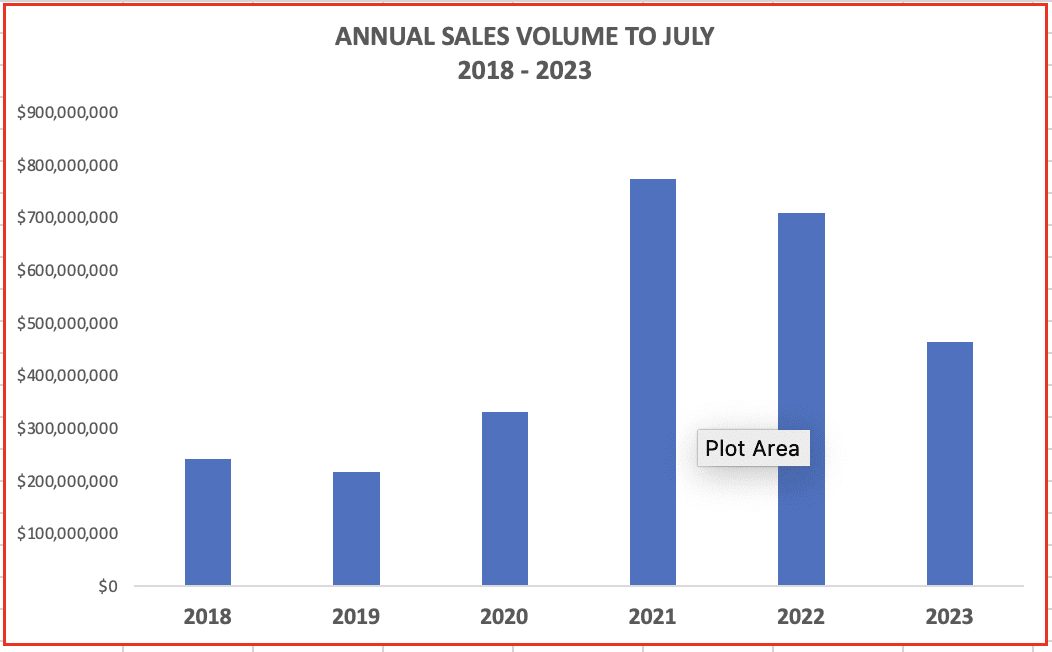
But, if we take 2021 and 2022 data out of the mix, and look at sales volume from 2018 to 2023, we have a 14% compound growth rate over 5 years. Nice. We are in a comfortable, predictable spot.

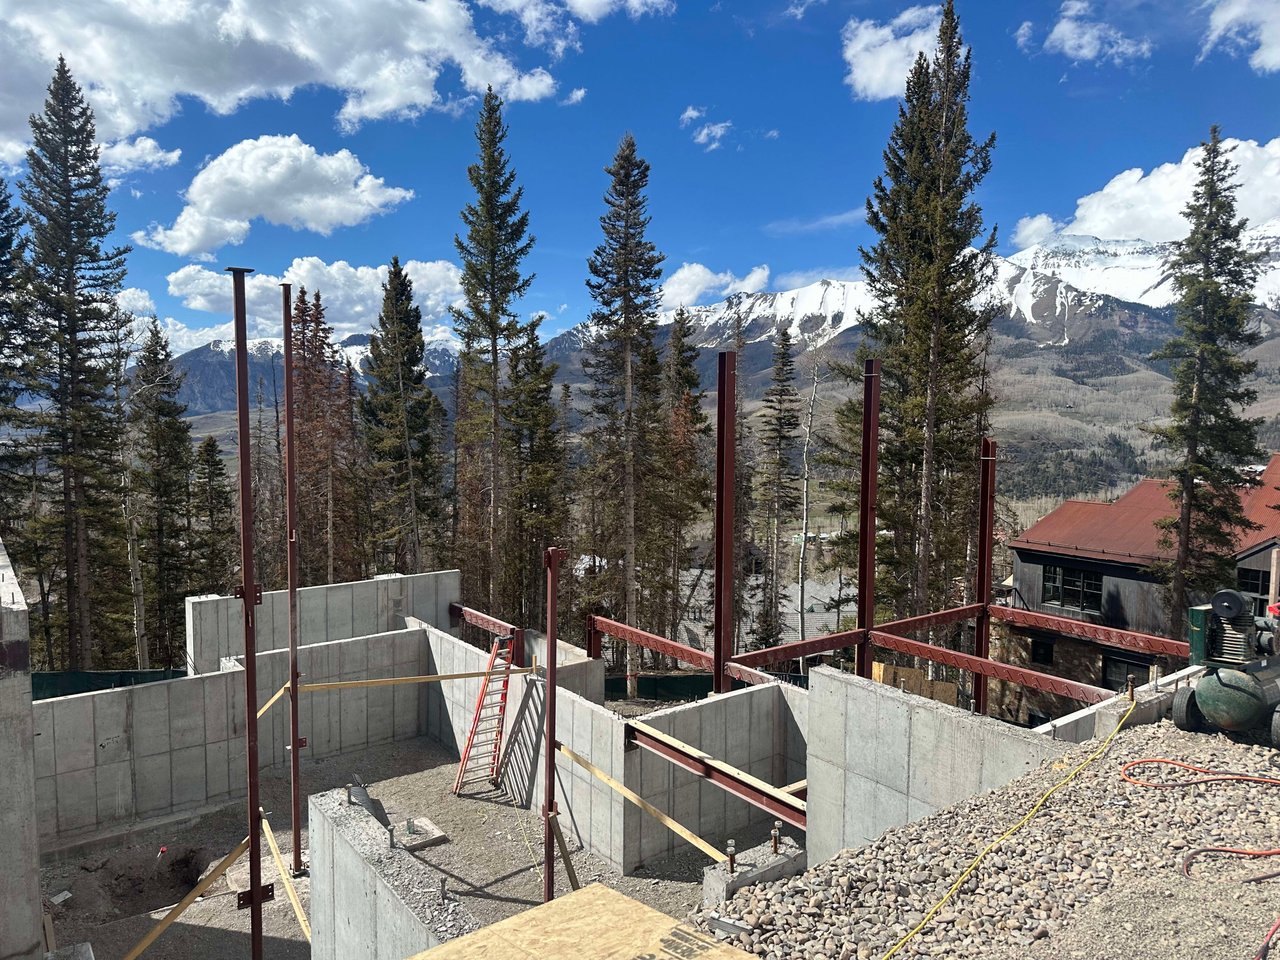
The number of sales is a different story. We didn’t go into 2021 with a lot of new inventory. It takes a long time to build a new house in the Town of Telluride or up in the Mtn Village

Generating twice our normal number of sales in 2021, buyers gobbled up attractive properties and drove pricing higher.
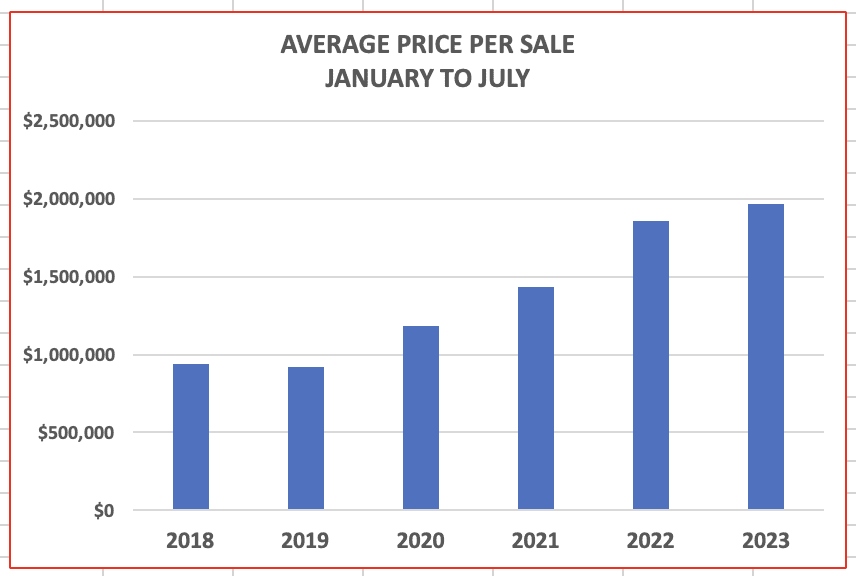
With more high-end inventory available, the average price of a single family home in the Mountain Village rose over 25% from 2022 to 2023.